
Park City Area Market Report
Sales, prices and momentum across Park City, Snyderville Basin, Jordanelle, Heber Valley and Kamas Valley for the third quarter of 2026.
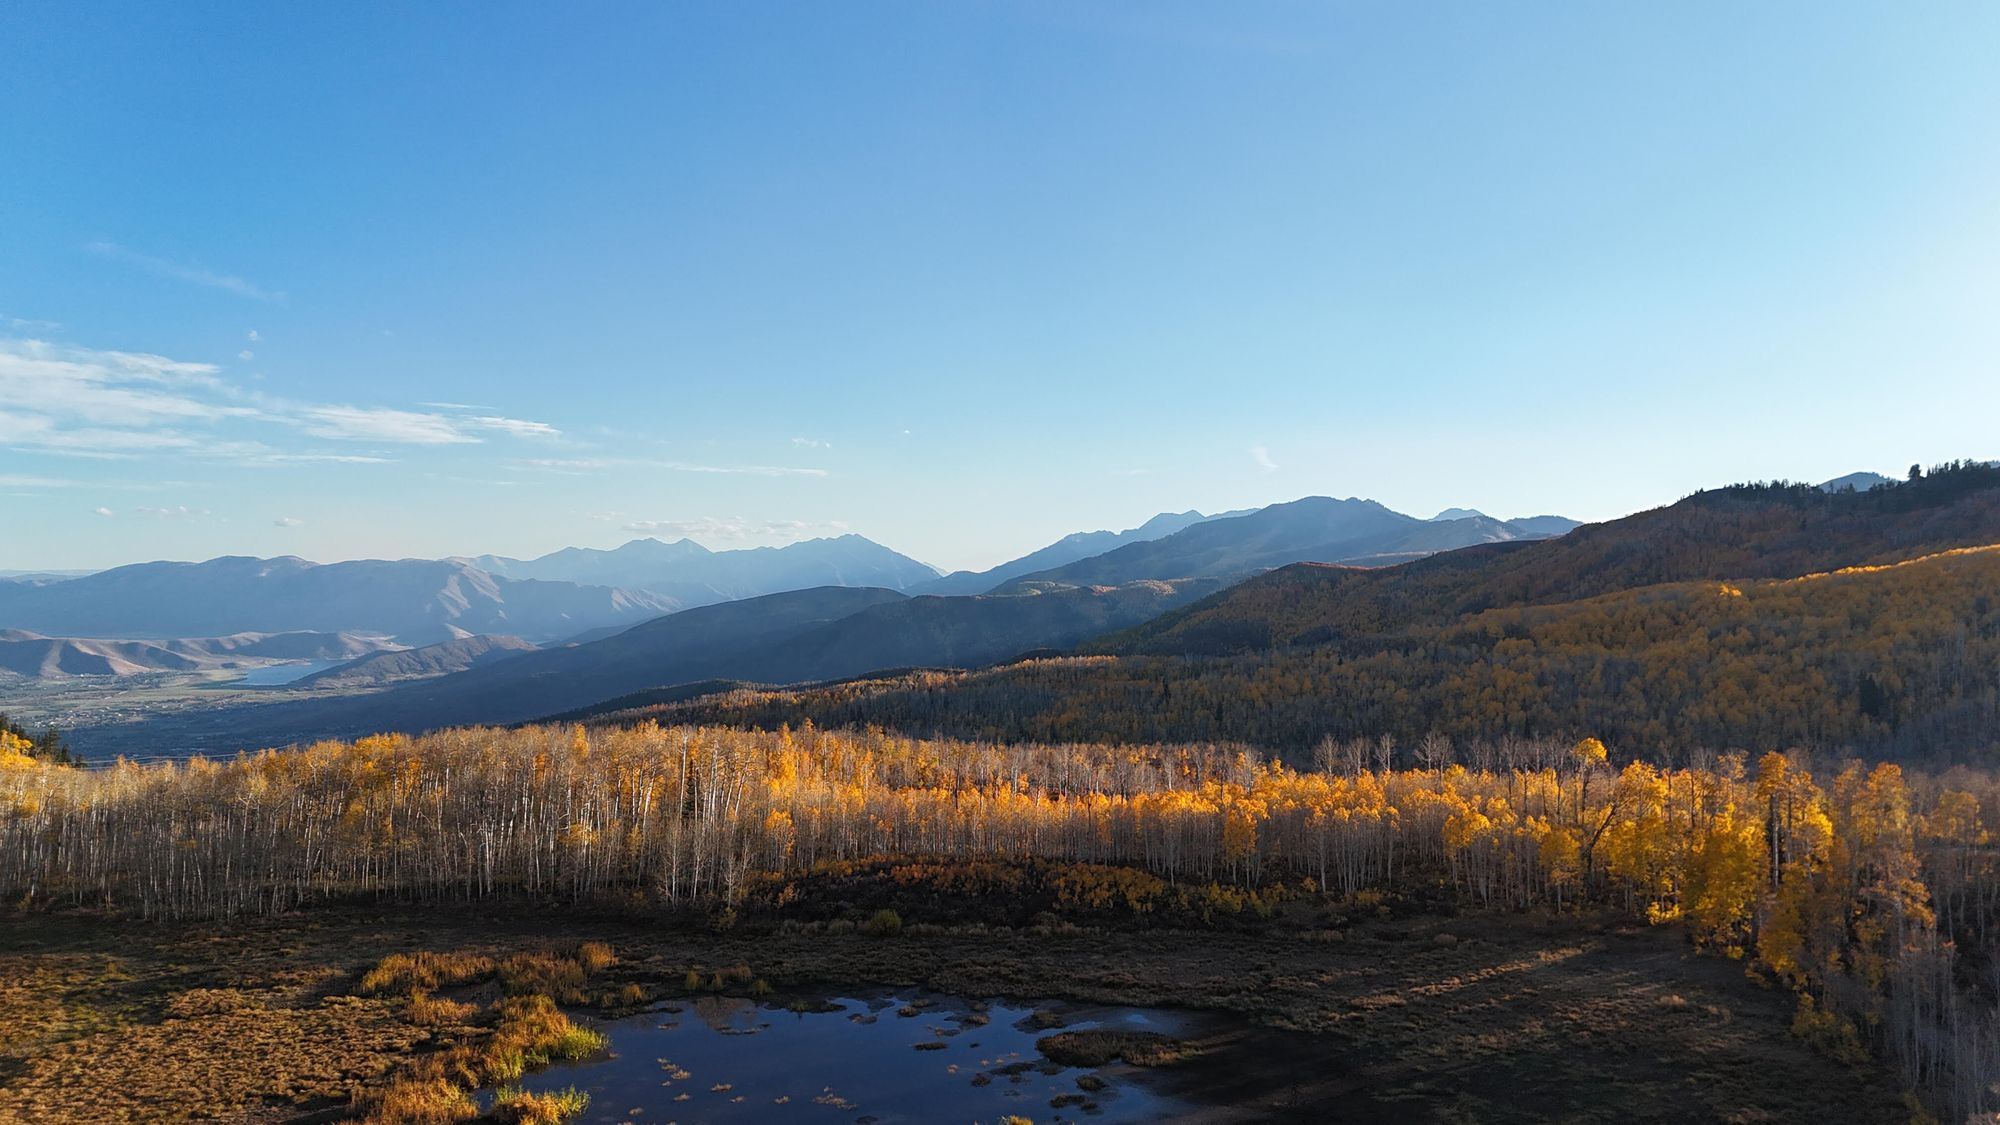
Third Quarter Snapshot
The third quarter of 2026 drew a sharper line between Park City’s property types than any quarter so far this year. Single-family buyers kept showing up for the right home, even as fewer of them closed. Land extended a run of outsized gains that now spans a full year. And condominiums pulled back sharply and broadly.
Combined, the market generated $1.591 billion in Q3 2026 sales, up 2% from Q3 2025, on 7% fewer transactions. That combination, modestly higher dollars on a smaller number of deals, is this quarter’s headline: price levels are holding even as the pool of transactions narrows.
Summary of Major Areas
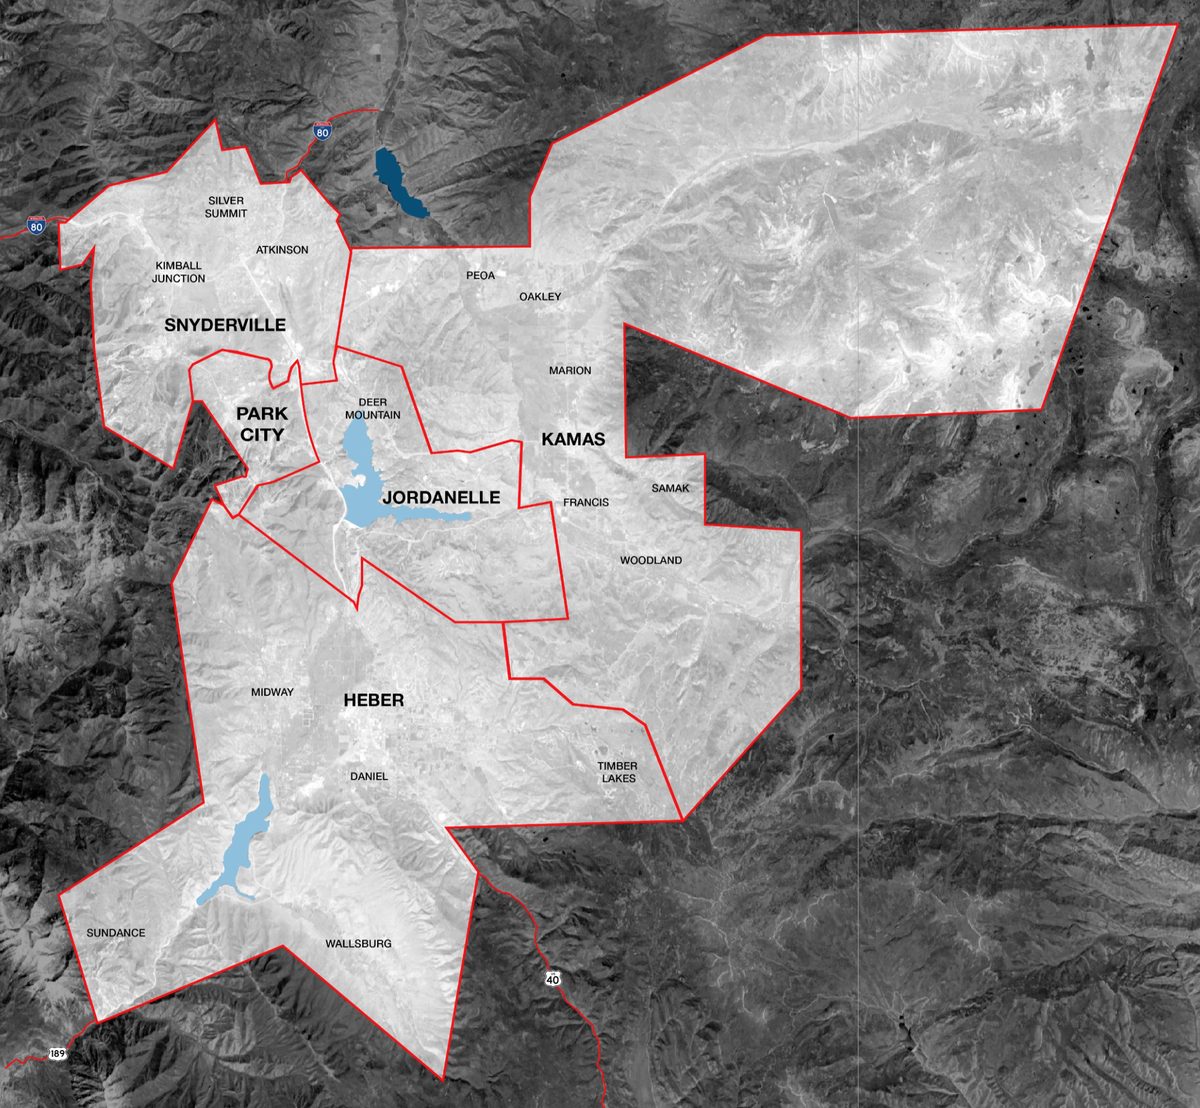
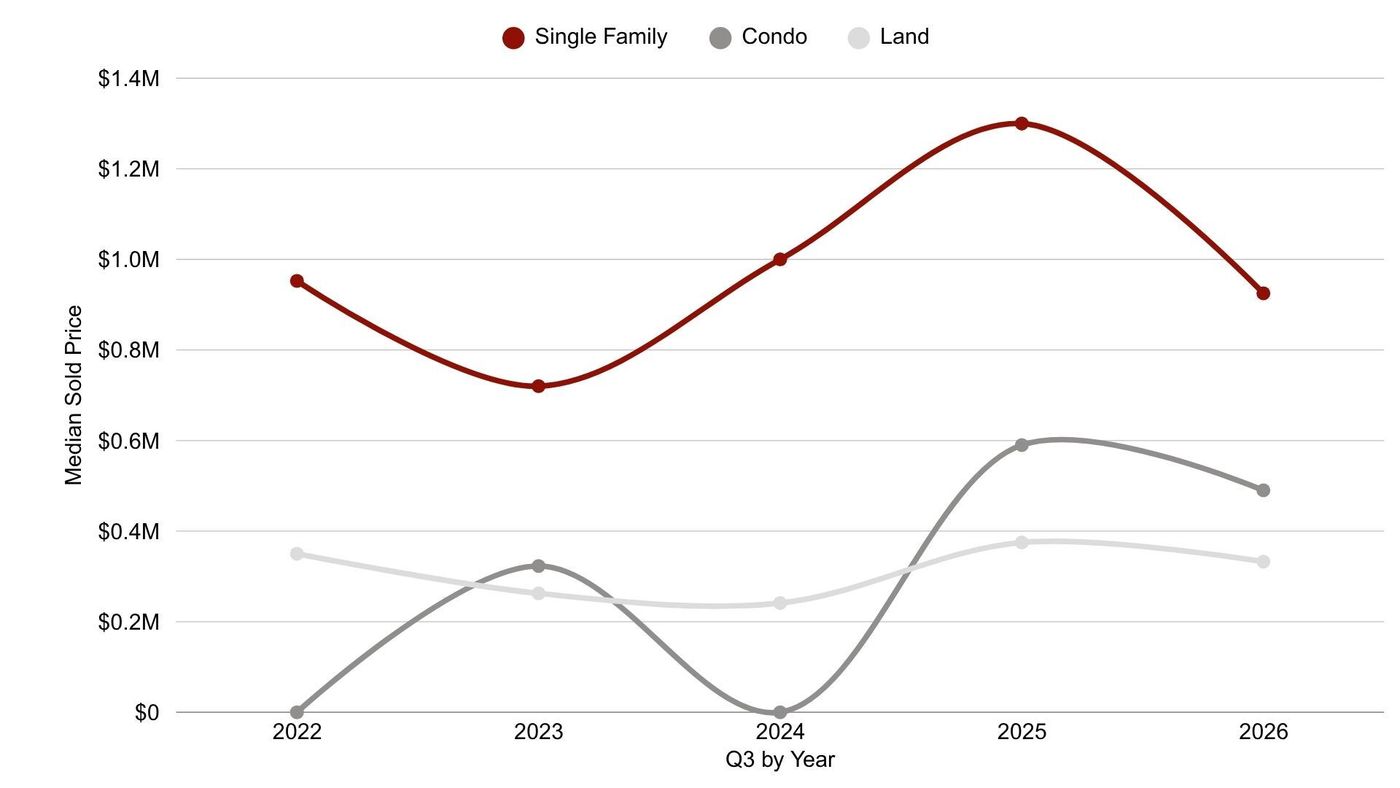
With 399 single-family transactions generating $1.139 billion in Q3 2026, down 1% in units but up 10% in volume from Q3 2025, the single-family market extended a pattern seen throughout 2026: fewer sales, higher average prices.
The rolling 12-month picture confirms the trend is durable: 1,347 sales totaling $3.730 billion, up 5% in units and 9% in volume.
Within the Primary Service Area (Summit & Wasatch Counties), 332 homes sold for $1.038 billion, down 2% in units but up 11% in volume, with the area median rising to $2.01 million from $1.90 million a year ago.
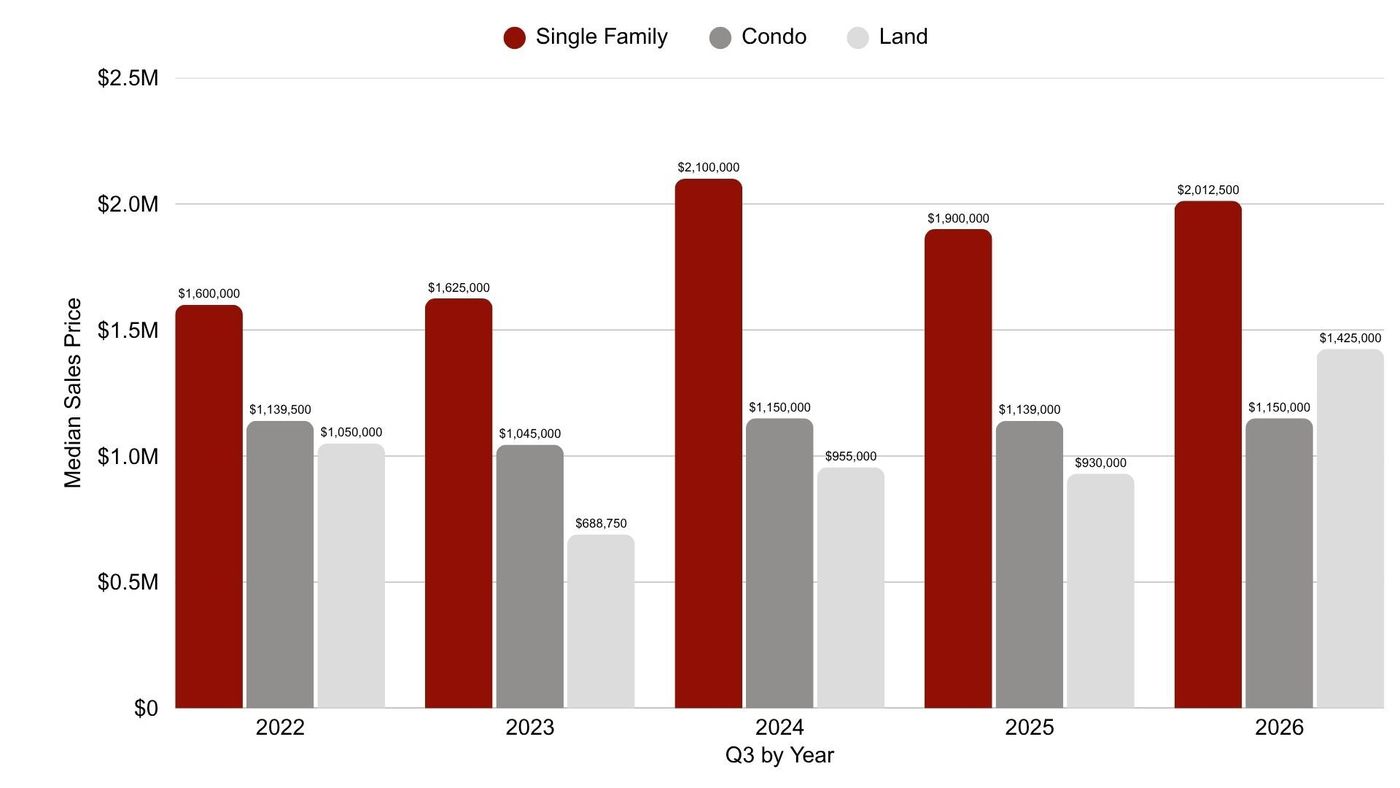
Data sourced from MLS for the period of 07/01/2026 to 09/30/2026. All information provided is deemed reliable but is not guaranteed and should be independently verified.
Park City Limits
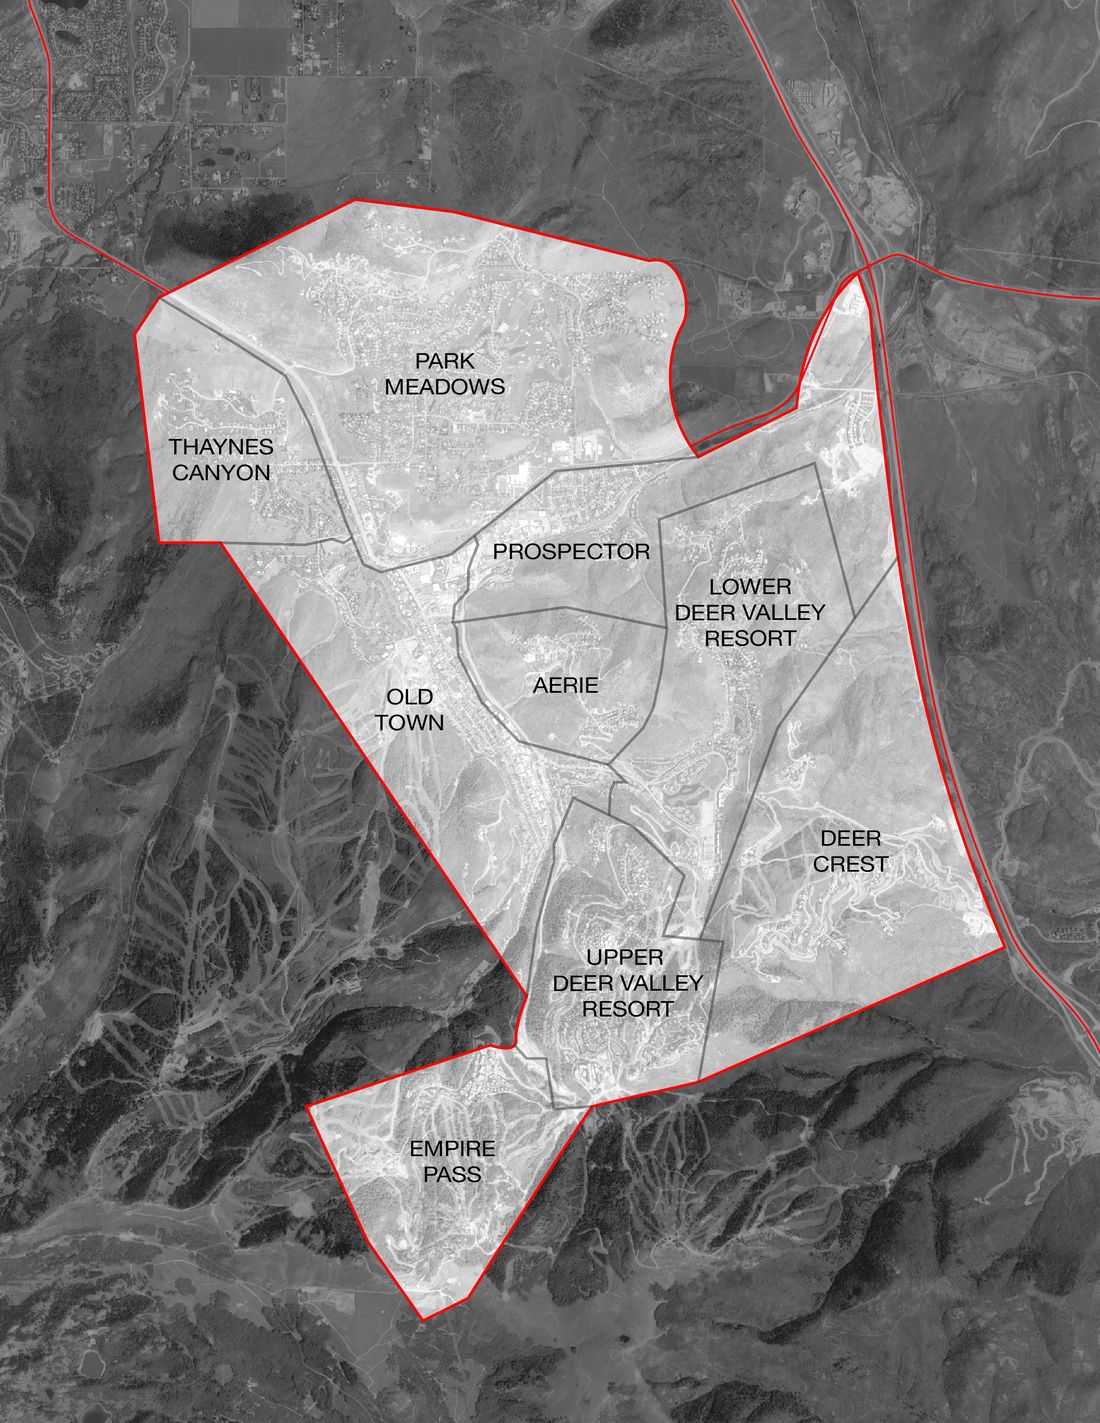
Park City proper cooled sharply in Q3, with sales falling from 49 to 29 (−41%) and volume down 25% to $185.3 million.
Old Town led the pullback, from 18 sales to just 4 (−78%), with volume down 54% to $12.9 million. Thaynes Canyon was the counterpoint: sales more than doubled (3 to 7, +133%), with volume up 158% to $35.4 million and a $6.39 million median.
Context matters area by area. Small sample sizes can swing dramatically on just a few transactions.
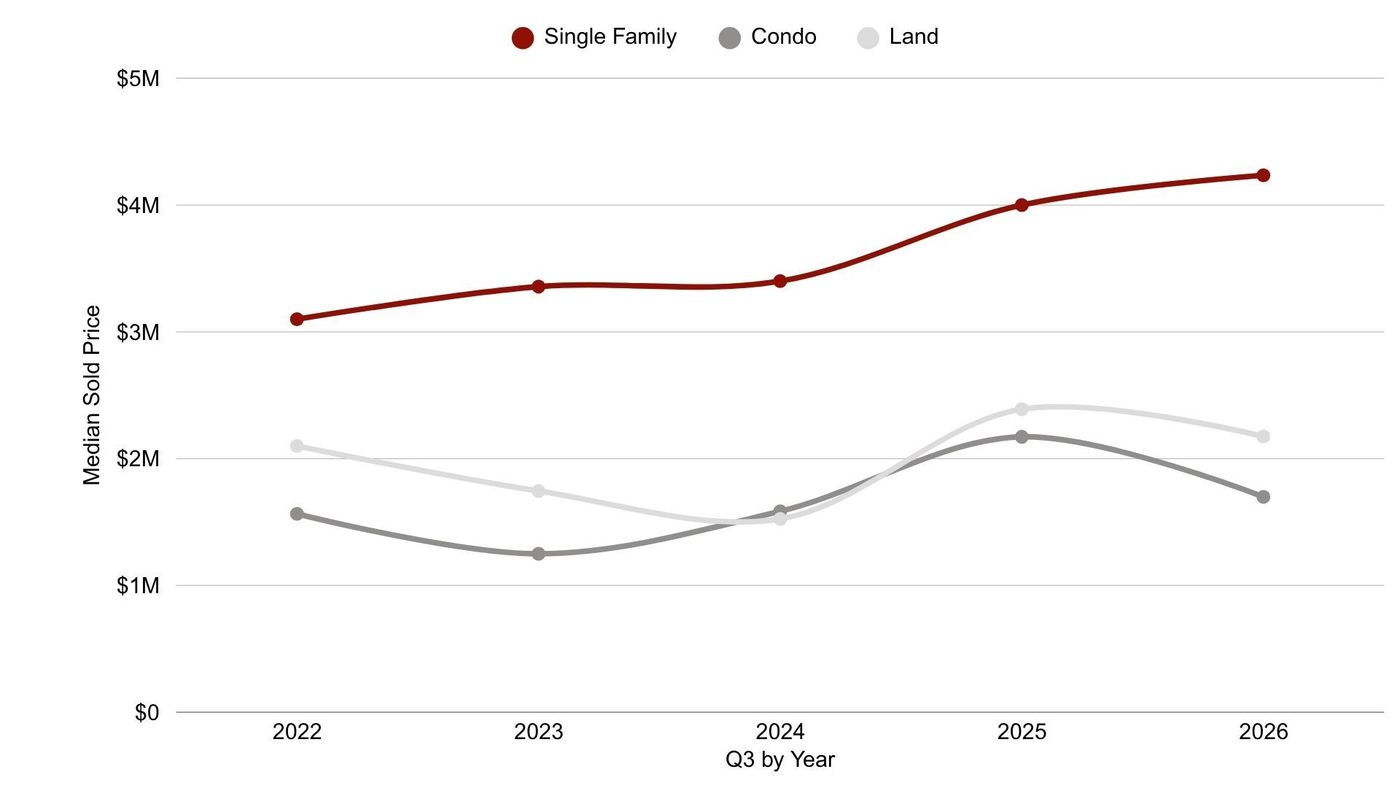
Data sourced from MLS for the period of 07/01/2026 to 09/30/2026. All information provided is deemed reliable but is not guaranteed and should be independently verified.
Snyderville Basin
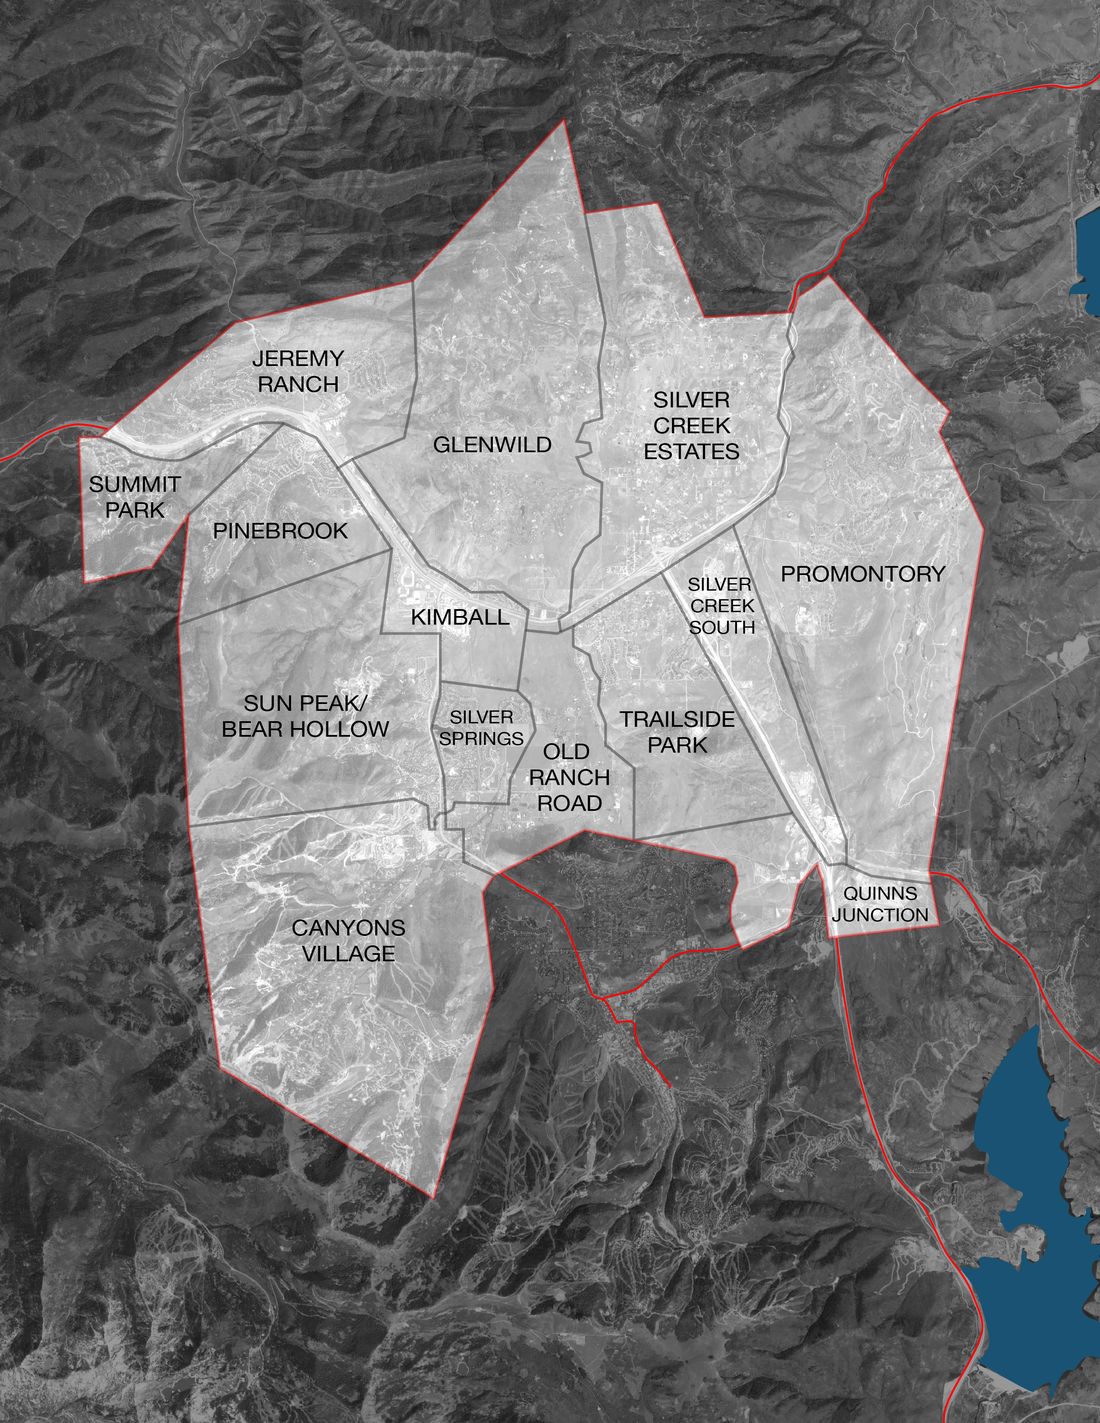
Snyderville Basin posted 126 single-family sales generating $510.4 million, up 18% in units and 54% in volume, the strongest dollar gain of any major area.
Promontory (Area 22) was the driver: sales doubled from 27 to 54 (+100%), with volume up 118% to $300.3 million and a median of $4.775 million.
Sun Peak/Bear Hollow also stood out, more than doubling in volume (+211%) on a jump from 3 to 6 sales. Jeremy Ranch moved the other direction, down 67% in units and 65% in volume.
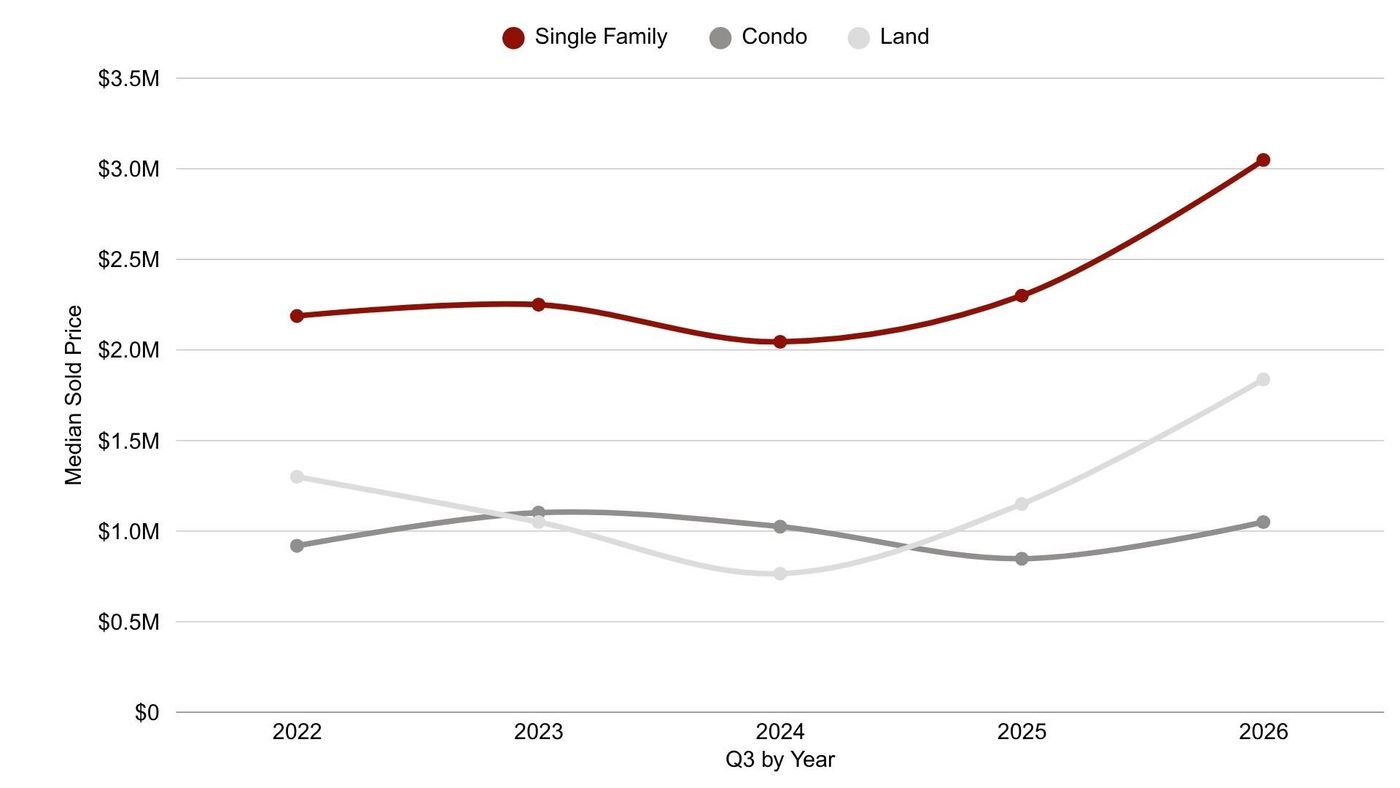
Data sourced from MLS for the period of 07/01/2026 to 09/30/2026. All information provided is deemed reliable but is not guaranteed and should be independently verified.
Jordanelle
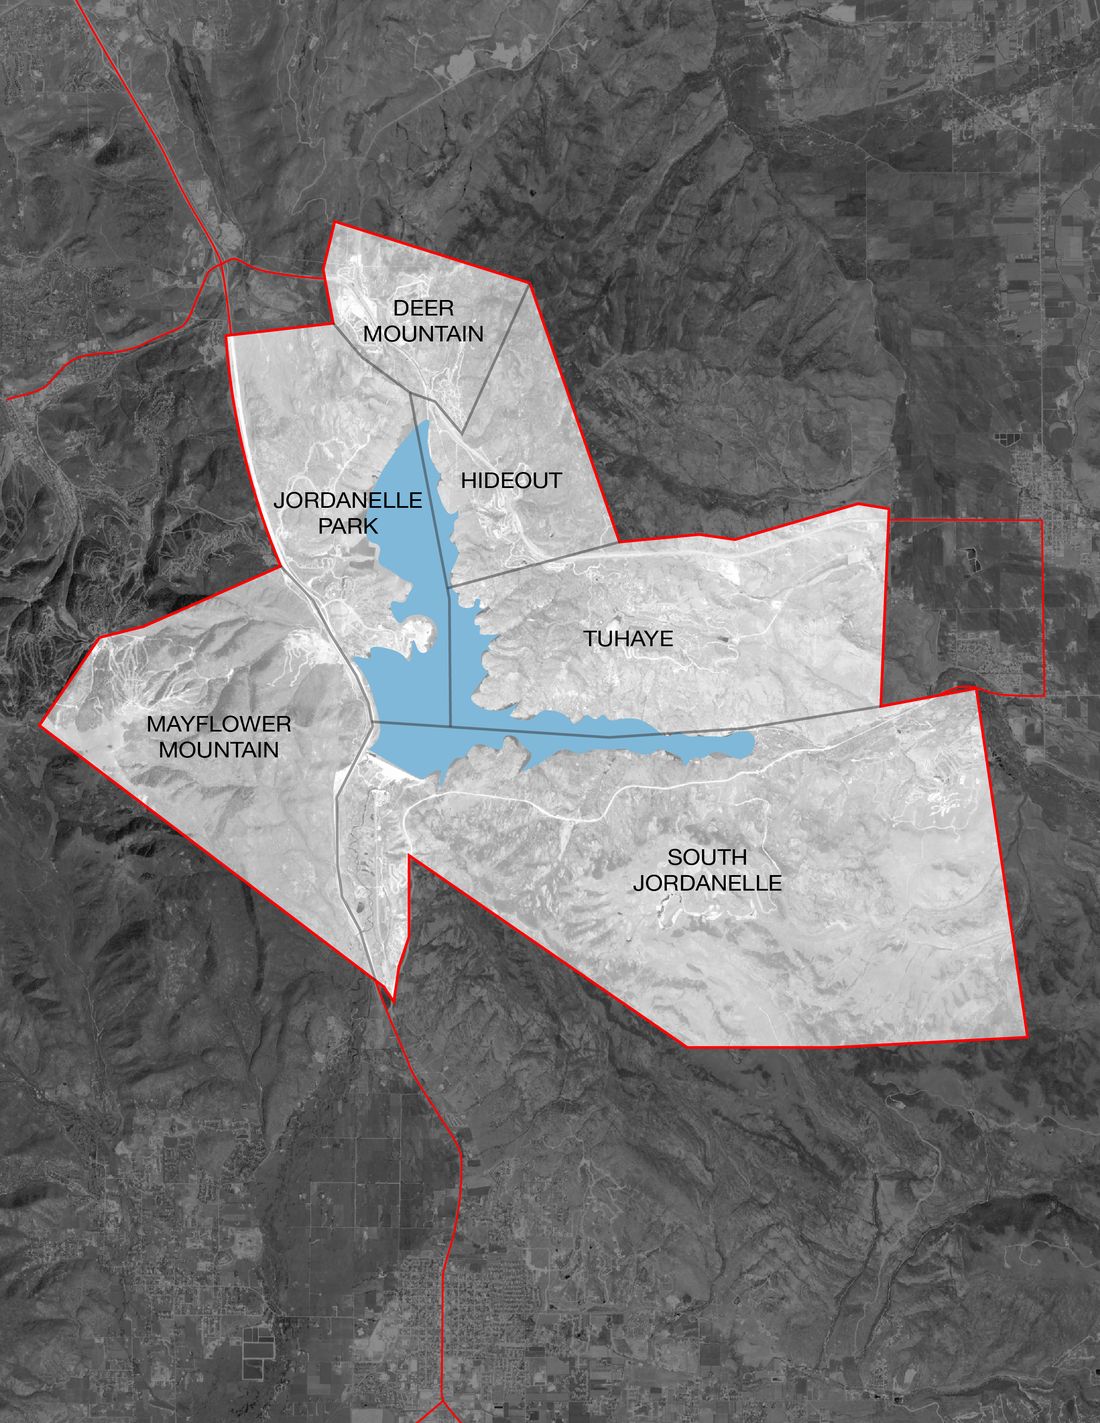
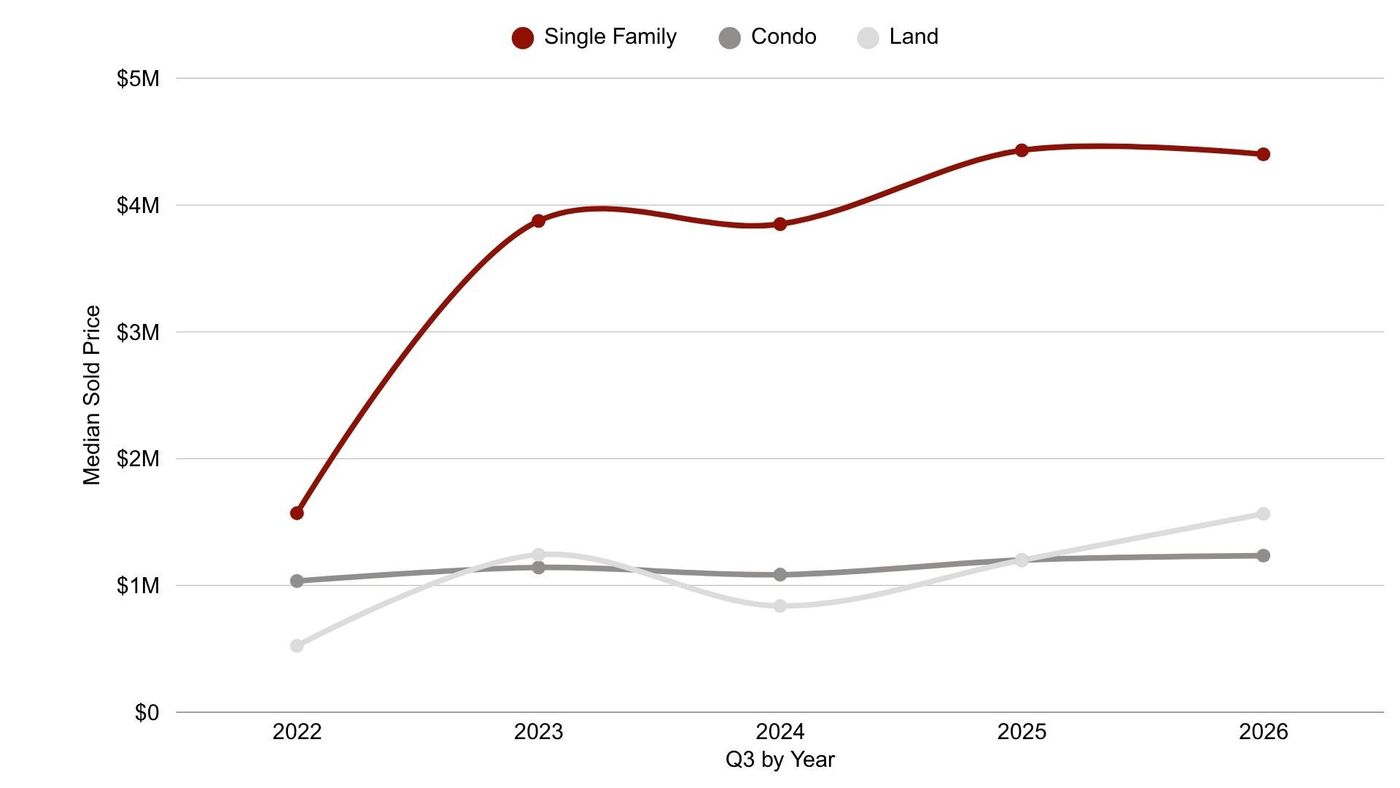
Jordanelle single-family sales fell across nearly every sub-area: 32 to 21 transactions (−34%), with volume down 35% to $99.0 million. Mayflower-Jordanelle, Tuhaye, South Jordanelle and Hideout were all down double digits in both units and volume this quarter.
But the rolling 12-month figures tell a more constructive story. Mayflower-Jordanelle logged 26 sales over the trailing year, up 86% from 14 a year prior, as the newer neighborhood continues finding its footing even as any single quarter can look soft.
Data sourced from MLS for the period of 07/01/2026 to 09/30/2026. All information provided is deemed reliable but is not guaranteed and should be independently verified.
Heber Valley
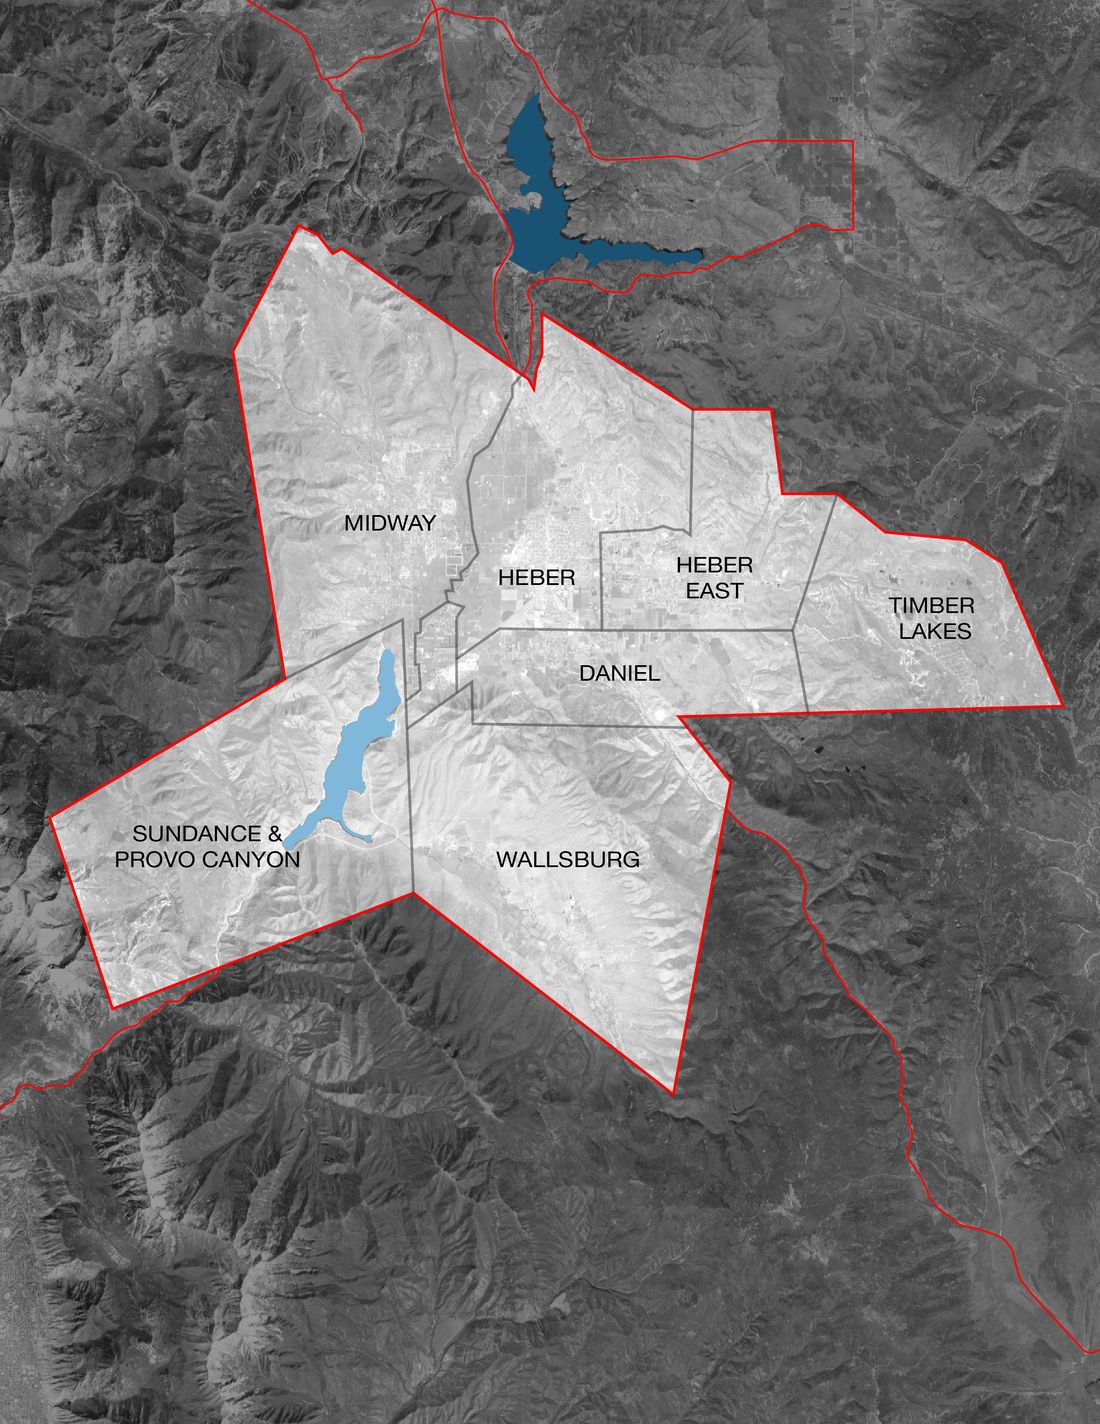
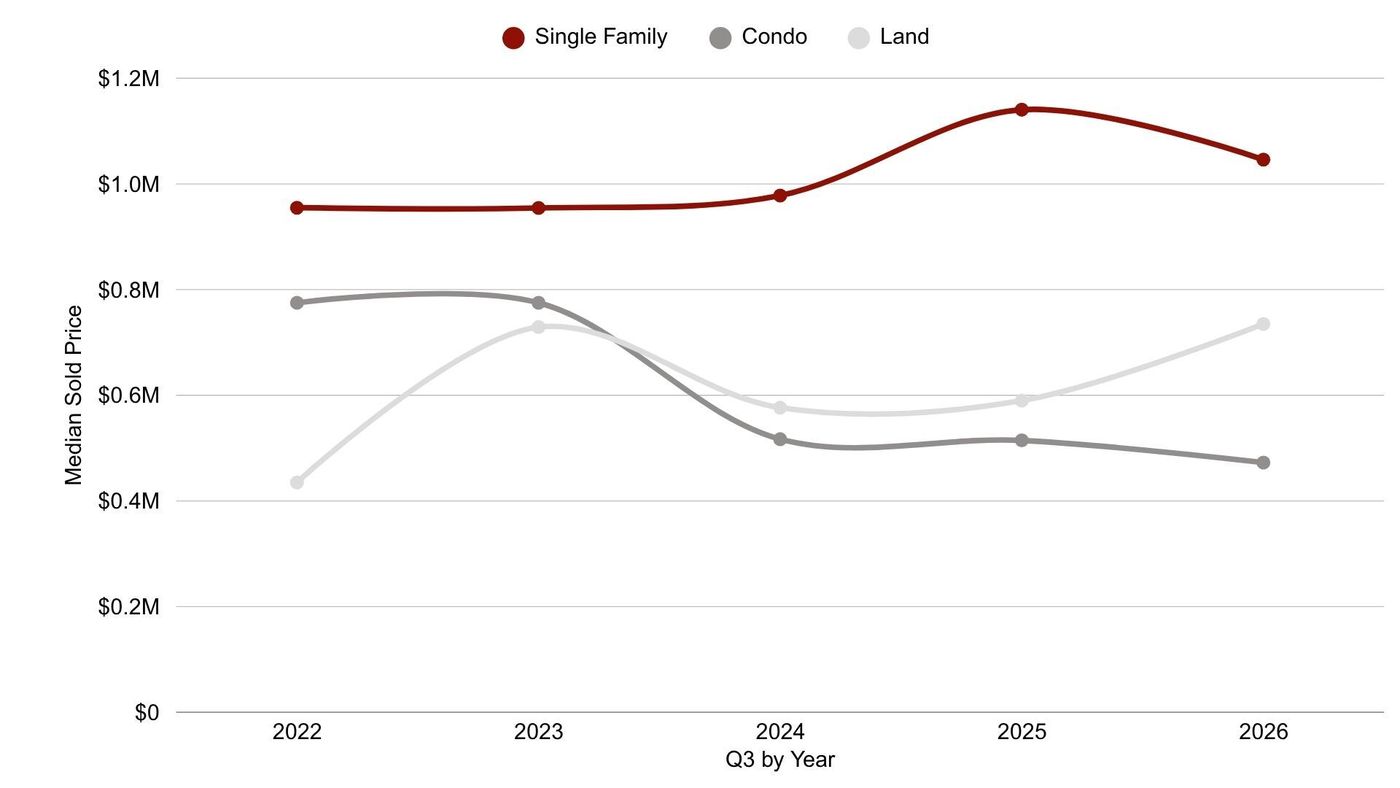
Heber Valley held essentially flat in units (108 to 106, −2%), but volume rose 10% to $180.5 million.
Red Ledges drove the gain: 13 to 15 sales (+15%), with volume up 87% to $73.6 million on a $4.0 million median.
South Fields moved the opposite direction from last quarter’s surge, falling from 5 sales to 1 (−86% volume), a reminder that small-area quarterly swings run in both directions.
Data sourced from MLS for the period of 07/01/2026 to 09/30/2026. All information provided is deemed reliable but is not guaranteed and should be independently verified.
Kamas Valley
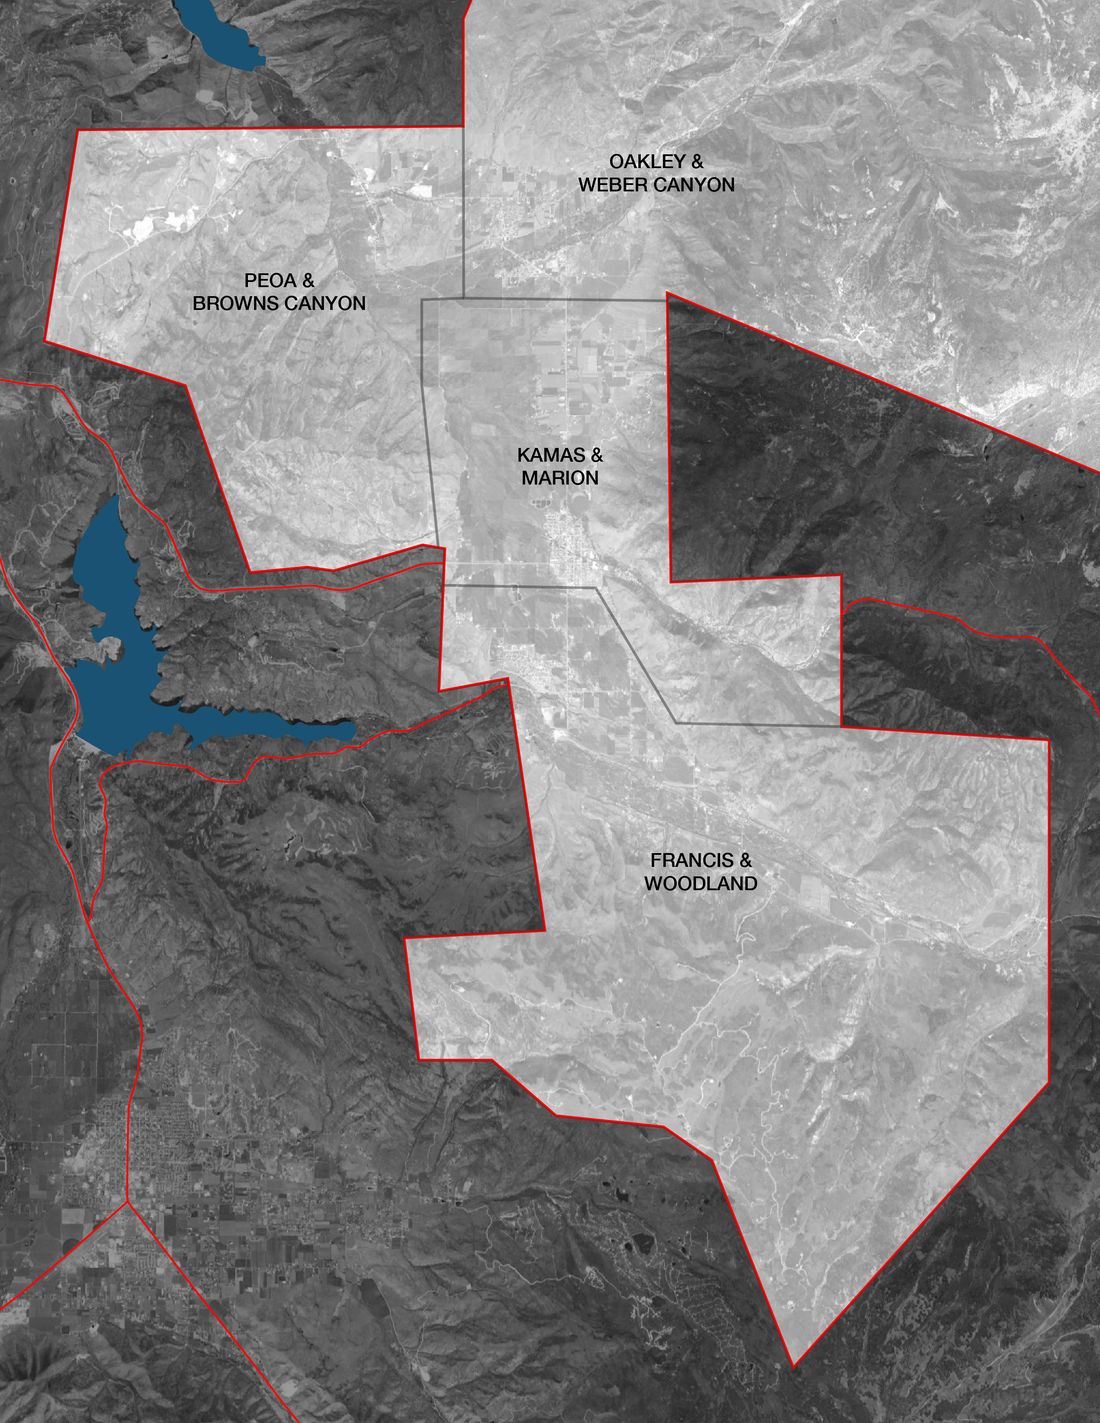
Kamas Valley single-family volume held essentially flat (+1%) despite a 16% rise in units, as Oakley & Weber Canyon absorbed more transactions at lower price points.
The outlier: Peoa and Browns Canyon, which had zero single-family sales in Q3 2025 and recorded one $8.3 million sale in Q3 2026.
One transaction can move a small area’s average dramatically; context matters.
Data sourced from MLS for the period of 07/01/2026 to 09/30/2026. All information provided is deemed reliable but is not guaranteed and should be independently verified.
A Market Finding Its New Shape
The greater Park City market enters the fourth quarter of 2026 with a more differentiated picture than it had six months ago. Land’s momentum looks durable rather than a single-quarter anomaly. Single-family demand remains real but increasingly selective, concentrated in specific sub-areas rather than spread evenly across the MLS. And condominiums are now in a genuine, broad-based correction that goes beyond the post-new-construction digestion story used to explain the softness earlier in the year.
The fundamental case for Park City real estate, namely scarcity, amenities, lifestyle, and a long track record of appreciation, remains intact. What has changed is the texture beneath the headline numbers: fewer total transactions are producing roughly the same aggregate dollars, which points to a market where buyers are being more selective about where, and at what price, they are willing to transact.
Land’s signal keeps strengthening
Historically, land activity leads the broader housing market by 12 to 24 months: buyers acquire lots today to build or sell tomorrow. Land is now up in both units and volume on both a quarterly and trailing-12-month basis, the most consistent trend line in the entire market. Snyderville Basin and Heber Valley posted the quarter’s clearest unit gains, Jordanelle’s volume rose even on flat unit counts, and South Jordanelle’s extraordinary Q2 spike continues working through the trailing-year numbers. That combination of breadth and duration is a meaningfully stronger signal than a single standout quarter.
The condo correction looks different than in Q2
Earlier in the year, condo softness was concentrated in a handful of areas digesting an unusually large wave of 2024 to 2025 new-construction closings. This quarter’s decline is broader: Park City Limits, Snyderville Basin, Jordanelle and Heber Valley all posted double-digit unit declines simultaneously. That pattern is harder to explain purely as a single-development supply story, and worth watching closely in Q4 to see whether it is demand pulling back, or simply the back half of the same digestion process.
Single-family is splitting into winners and losers
Old Town, Jordanelle broadly, and several smaller Heber Valley sub-areas all posted meaningful quarterly declines, while Promontory, Snyderville Basin overall, and Thaynes Canyon posted some of the strongest gains in the market. Rather than one single-family market moving in one direction, Q3 2026 looked like several smaller markets, each telling its own story, which argues for pricing and strategy decisions that are specific to the sub-area rather than the broader MLS trend.
Rate and insurance headwinds persist
Elevated mortgage rates and broader economic uncertainty continued to weigh on buyer confidence in the upper-mid market through Q3, consistent with the pattern seen earlier in 2026. The luxury segment, where cash transactions are more common, remains comparatively insulated. Fire-risk insurance reclassifications in parts of Summit and Wasatch Counties also continue to factor into purchase decisions in exposed areas, a headwind that is difficult to quantify precisely but is likely to grow in importance heading into 2027.